COVID-19 in Your Community
COVID-19 in Your Community is a free tool communities can use to compare COVID-19’s impacts in their communities to other jurisdictions in the United States. Using a series of automatically-generated graphs, a local community can see how their COVID-19 case load, days to double, and mortality rate stack up against their county, state and the United States as a whole. Communities can share a link to their continuously-updating dashboard, so other stakeholders have easy access to the information.

Get your community’s dashboard set up in less than 10 minutes.
1. Register an Account
Set up an account to begin comparing and tracking data based on your community.
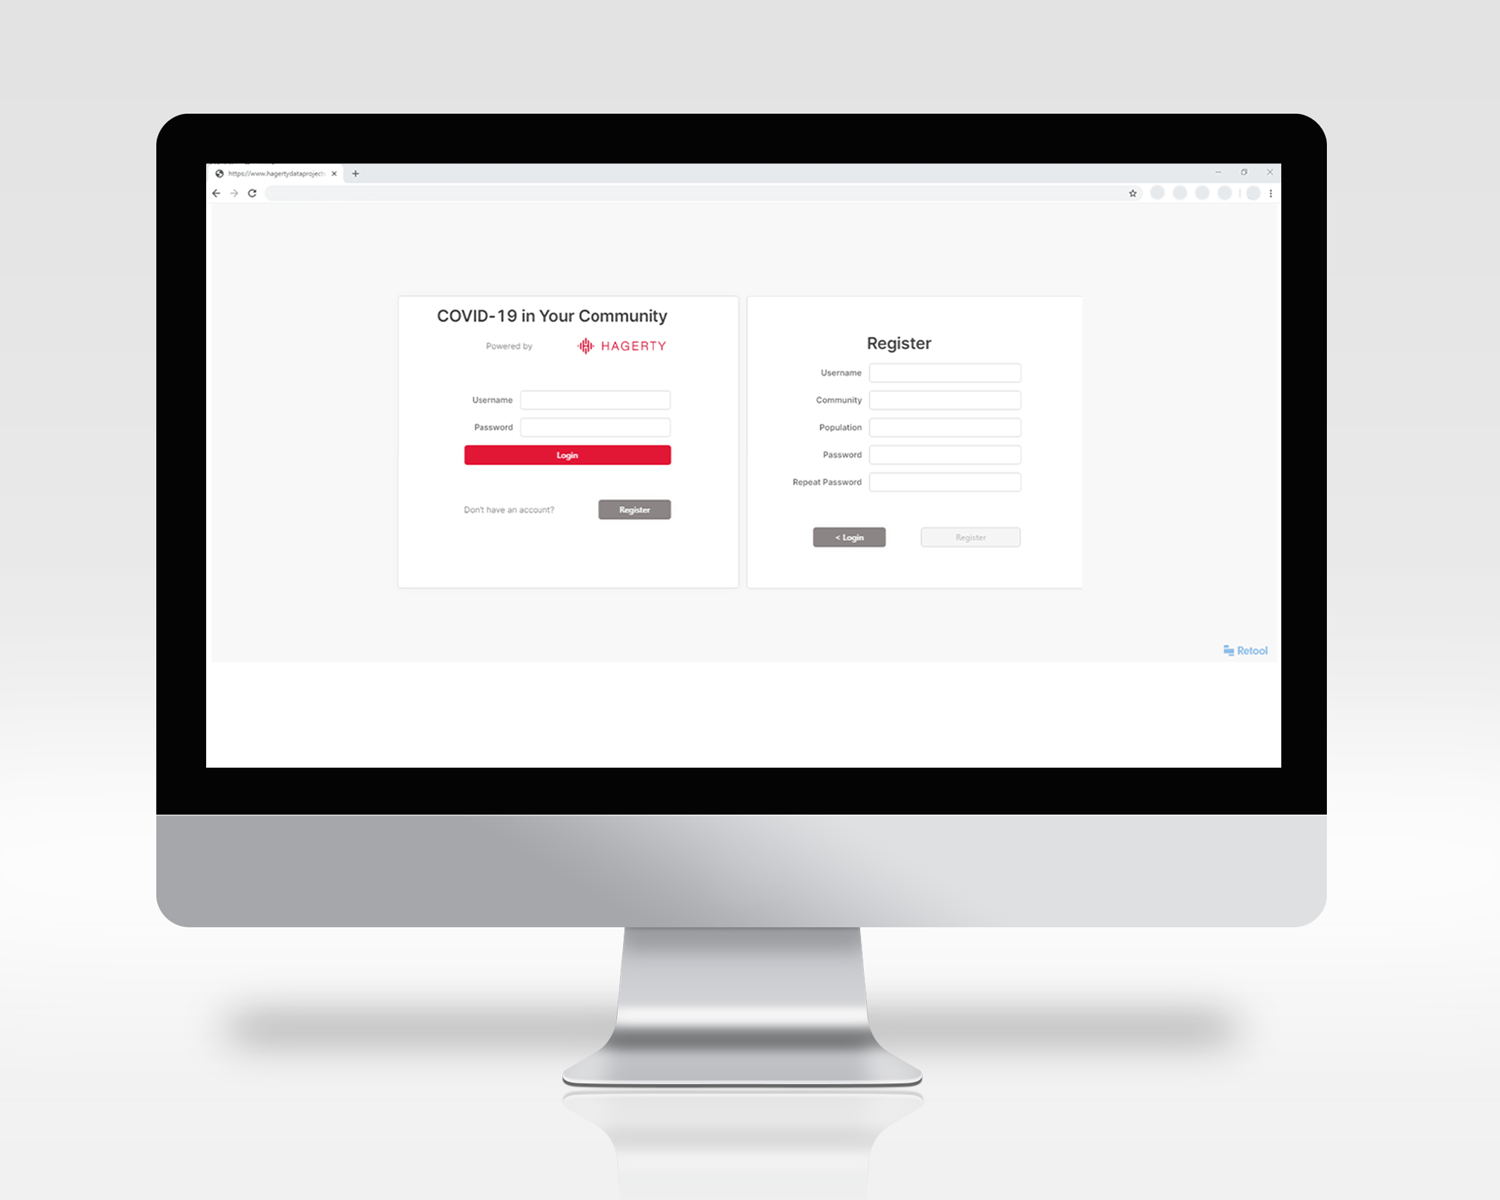
1. Register an Account
Set up an account to begin comparing and tracking data based on your community.
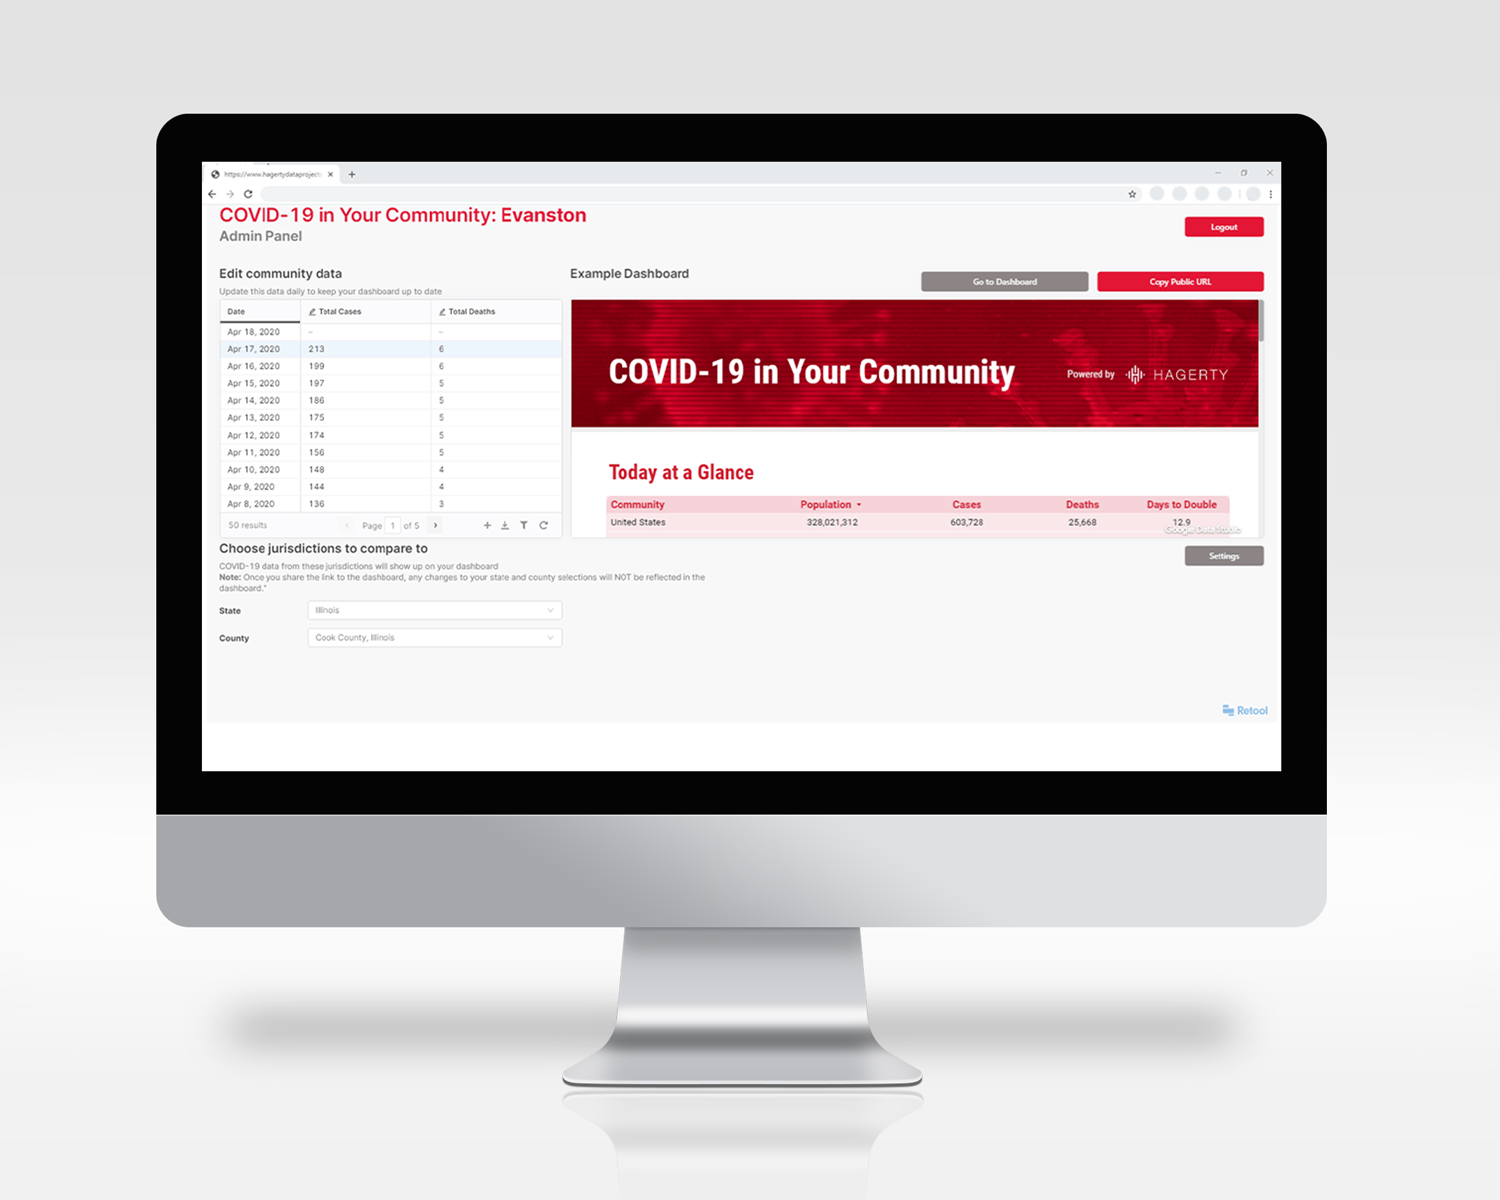
2. Begin Data Entry
Choose the state and county with which you want to compare your community.
Enter your community’s COVID-19 total cases and deaths by day since you started tracking this data.
Once you have your dashboard up and running, be sure to update your numbers daily to keep the dashboard’s tables and graphs up-to-date.
3. Easily Generate & Share
Share your automatically-generated graphs and tables comparing your community to other jurisdictions.
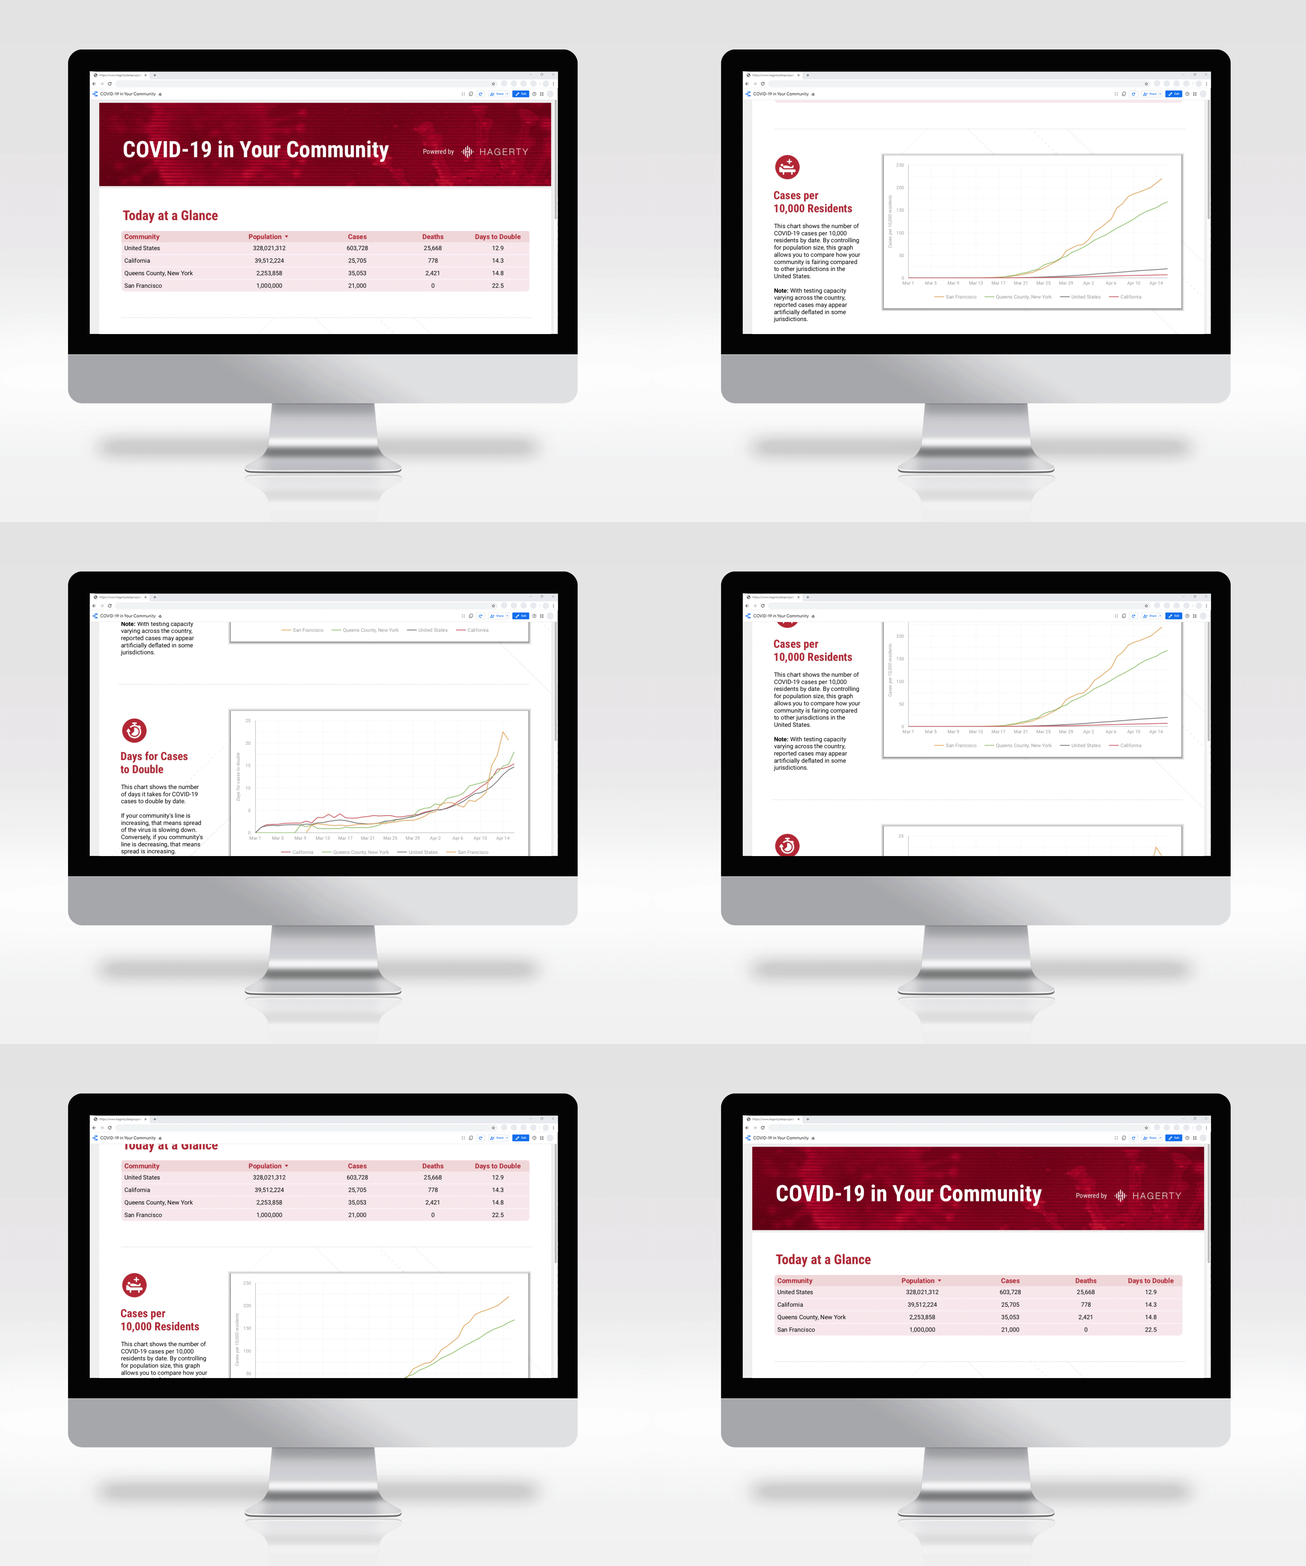
3. Easily Generate & Share
Share your automatically-generated graphs and tables comparing your community to other jurisdictions.
Register and build your community’s dashboard today.
Need some assistance?
If you have any questions about registering your account, sharing with your community, or other additional questions you may have while producing your community’s dashboard, please contact sean.vandril@hagertyconsulting.com.